

Looking for the latest figures? The daily Bitcoin ETF flows — latest day, month-to-date and year-to-date, fund by fund — are on our live flows page, updated every market day.
The corporate Bitcoin market enters July 2026 with the coldest sentiment since the spot ETFs launched. The data SatsIntel aggregates paints a picture of stress on three fronts — flows, price and preferred fixed income — alongside an institutional base that hasn't moved. This is the full picture, nuances included.
The ETFs close their worst month of flows
June ended with $4,601 million in net outflows from the US spot Bitcoin ETFs, the worst month since daily flow records began (January 2025), ahead of the toughest months of 2025 (November, with about $3.5 billion in outflows, and February, with about $3.4 billion). The second half of the month took the punishment: between June 17 and July 1 the funds strung together ten consecutive sessions of redemptions, with daily peaks of $490-690 million in the final stretch.
The streak broke on July 2 with net inflows of about $224 million, the first positive session in three weeks. After the July 3 holiday, Monday the 6th came in essentially flat on provisional data. Year to date, the ETFs have now accumulated almost $6 billion in net outflows — their first year of sustained redemptions since launch, after a firmly net-buying 2025.
The price: half the all-time high
Bitcoin trades in the $63,000-64,000 zone, after closing June around $60,100. That is roughly half the ~$126,000 all-time high set in October 2025. A drawdown of this size is not unprecedented — Bitcoin's history includes several corrections beyond 50%, and the 2022 one reached 77% from the top — but it is the first time it happens with an institutional ecosystem of this scale built on top: ETFs, listed treasury companies, preferreds and CEDEARs.
For Bitcoin treasury companies, the drawdown activates the classic question: who holds and who sells? SatsIntel's treasury stress test simulates what happens to each company's balance sheet and debt under further declines.
Preferred fixed income, below par
The third front is the funding machinery. As we reported in late June, the perpetual preferreds funding the two most active treasuries in fixed income trade well below their $100 par value: Strategy's STRC closed June around $81 and Strive's SATA around $89. These instruments are designed to trade pinned to par; seeing them at these levels makes ATM issuance more expensive and is the most honest thermometer of the market's appetite to fund new BTC purchases.
What hasn't moved: 175 companies and 1.28 million BTC
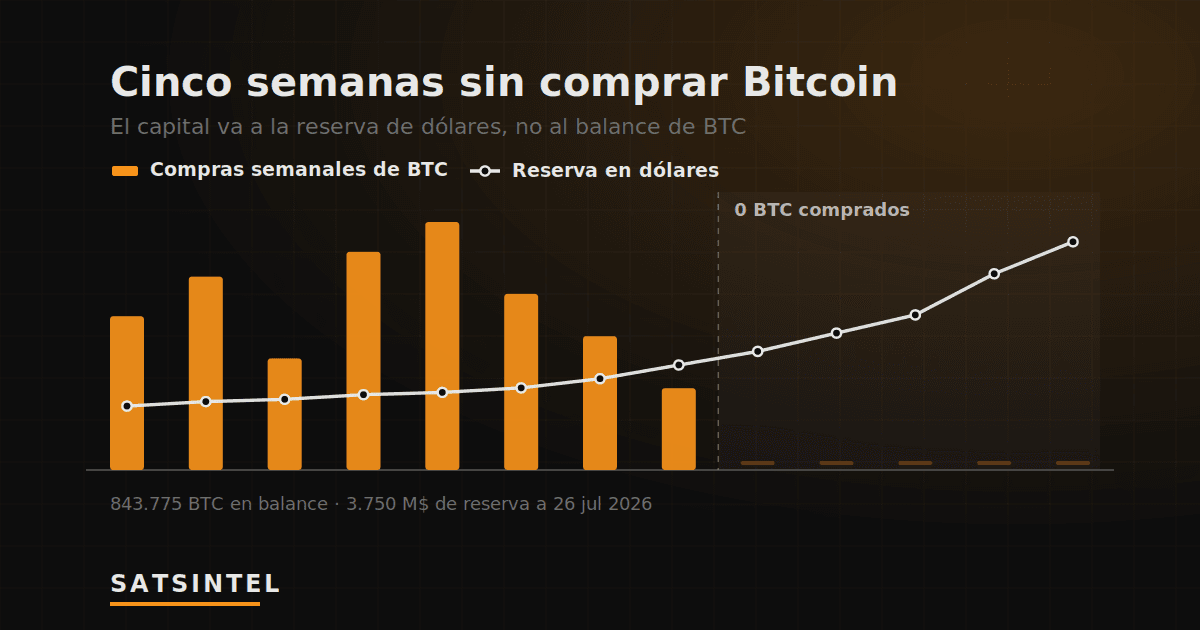
Against that backdrop, the structural datum: 175 listed companies hold 1,279,882 BTC on their balance sheets — around 6.1% of all the Bitcoin that will ever exist — worth some $80.7 billion at current prices. Strategy still concentrates about 843,800 BTC, close to two thirds of the corporate total. The treasuries directory tracks the live figures, company by company.
The sentiment read is two-sided. The most tactical money — ETF flow — has been leaving for six weeks; the structural money — corporate balance sheets — hasn't sold. In previous cycles that divergence resolved in both directions, so it isn't a directional signal on its own: it is the map of who stands on each side.
The signals to watch from here
Three metrics concentrate the information in a market like this. First, the daily ETF flow (updated every morning on our daily flows page): if the July 2 inflows have follow-through, the worst quarter of flows may be behind. Second, the mNAV of the treasury companies (in the mNAV calculator): discounts to the value of the Bitcoin on the balance sheet signal capitulation or opportunity, depending on where you sit, and historically they haven't lasted. And third, the behaviour of the preferreds versus par: their recovery toward $100 would be the clearest sign that the funding of accumulation is flowing again.
The market is testing the corporate Bitcoin thesis at this scale for the first time. The coming months will tell whether the treasury model is going through its first institutional winter — or whether this is the transfer from weak hands to strong ones that has marked every previous cycle.